Property Market News
Understanding Leicester Apartment Distribution: A Closer Look
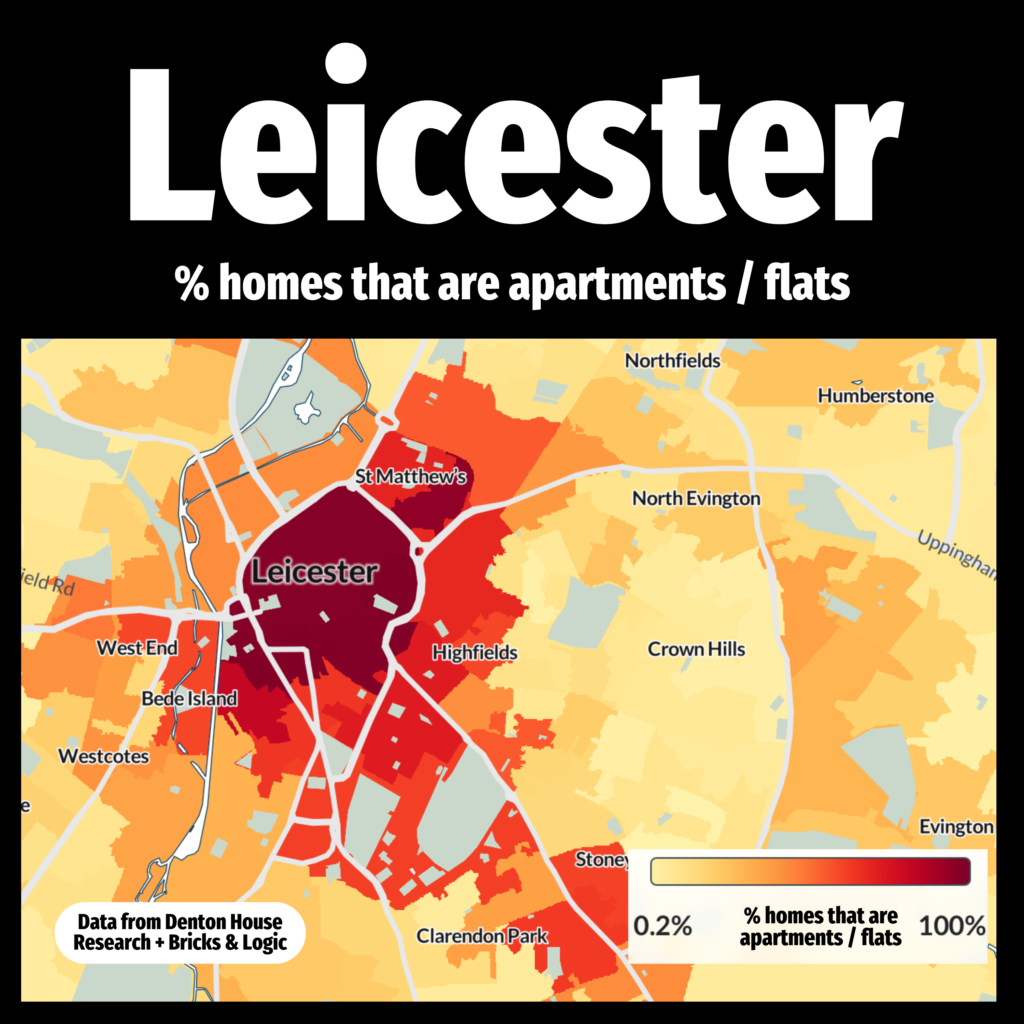
As a leading estate and letting agent in Leicester, I present this detailed heat map showcasing the distribution of apartments and flats across the city. This map is a valuable resource for both homeowners and landlords, providing insights into the varying densities of apartment living in different areas of Leicester.
The red areas, boast the highest concentration of apartments, tending to make it an ideal location for those seeking a vibrant urban lifestyle with easy access to amenities. Conversely, areas shaded in lighter yellow hues indicate a lower prevalence of apartments, appealing to those who prefer quieter, more residential neighbourhoods. Any grey areas are where no apartments exist.
The diverse distribution shown on this map underlines the unique character of Leicester housing market. Whether you are a landlord looking to invest in high-demand areas or a homeowner seeking the perfect balance between urban and suburban living, this map serves as a comprehensive guide to making informed decisions in Leicester.