Uncategorized
Insight – Percentage of Single Occupancy Households in Leicester
In the ever-evolving landscape of the Leicester property market, understanding the demographics of occupancy rates is pivotal for both buyers and sellers.
As a Leicester estate agent, I’ve published this heat map from the Office of National Statistics to shed light on the distribution of single-occupant homes across various areas of Leicester from the Census in 2021, providing a unique insight into the current living trends within our community.
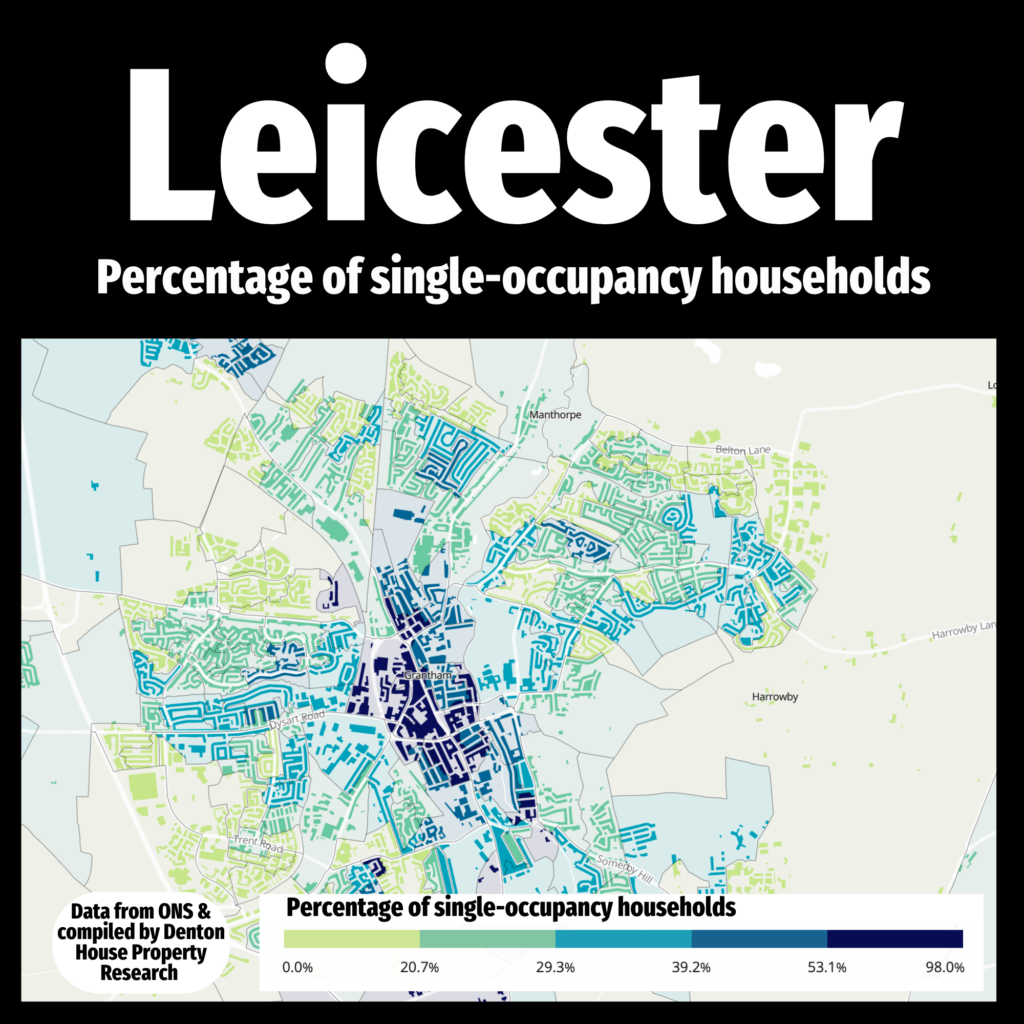
This visualisation, using publicly available information, is particularly invaluable for potential buyers seeking neighbourhoods that resonate with their lifestyle preferences, be it the quietude of a predominantly single-occupant area or the vibrancy of a more diverse community. For Leicester sellers, this map offers a strategic understanding of their property’s positioning, potentially attracting the right demographic. Moreover, this information can guide developers and buy-to-let Leicester investors in making informed decisions about future projects, ensuring they cater to the evolving needs of residents. By presenting this heatmap, we at the Leicester Property Blog aim to empower our clients with comprehensive data, fostering informed decisions in the Leicester property market.